

Sometimes you will come across the need for measuring some system resources for your project. If your project is running on top of Linux, I have good news for you!
In this article, I will present two useful tools, and their basic usage, of how to read and track useful information about your system resources over CPU and Disk I/O.
The first command to deal with Linux CPU and Disk I/O statistics is iostat
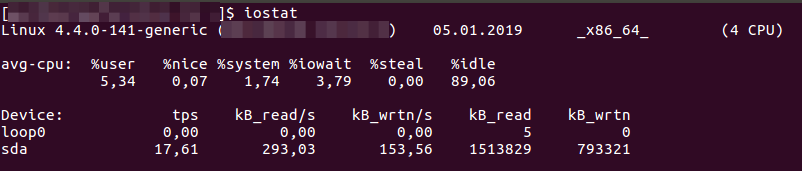
As you can notice above, the command displays a group of information starting by the Linux Kernel used, the average CPU used (second line) and device(s) statistics about writes and reads (third line and following).
If you get problems to run the iostat command it’s probably because either you didn’t install the sysstat package or you didn’t start up the service.

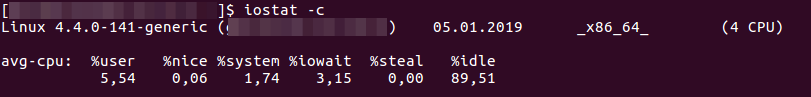
The iostat command has two particularly interesting flags, “-c” and “-d“, respectively for CPU and Disk I/O.
Using the command with the -c flag, only information about your CPU will be displayed.
Two columns may catch your attention, they are the %idle, which describes how inactive/free is your system and, the %user, that shows the use of CPU related with the user level application(s).
The -d flag works in the same way, filtering only information about Disk I/O.
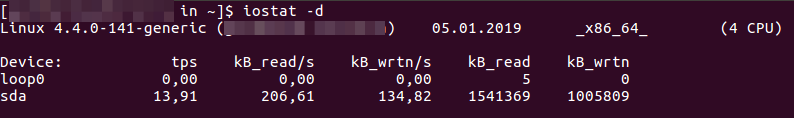
The columns kB_read/s and kB_wrtn/s show the amount of KB read and written over a second. Disk I/O statistics may be an important information depending of the goal on your application.
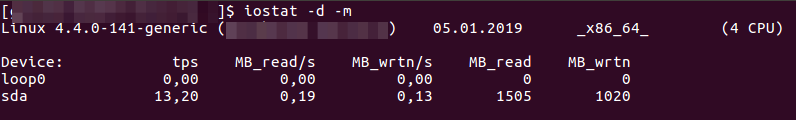
If you prefer to read data using MB, the key is to use an additional flag -m.
So far, so good! But if you want to see all this data displayed, let’s say, in a huge report screen, during a certain period of time? It can be achieved using only two extra parameters, like below:
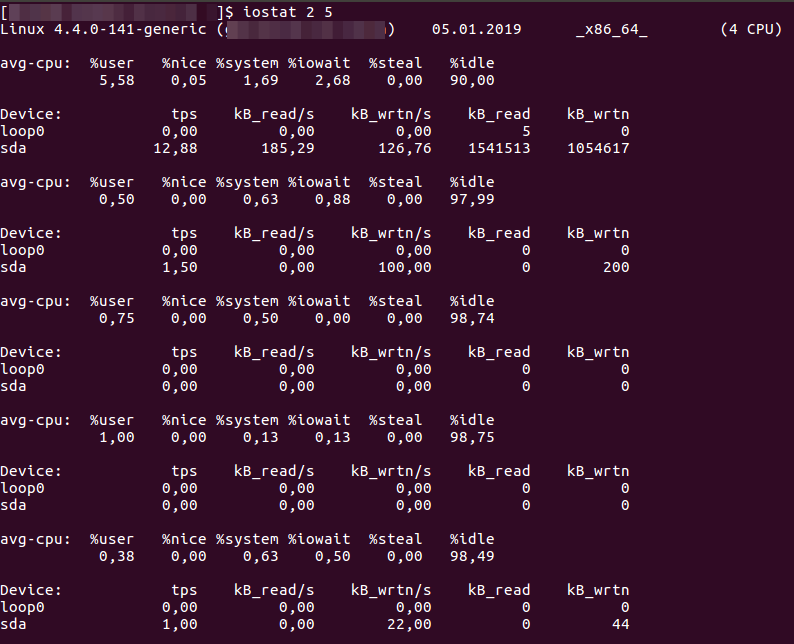
The first parameter, i.e. the number 2, tells us how many seconds to wait between each execution. The second parameter (5), is the amount of repetition. We can conclude that the command above runs every 2 seconds, 5 times.
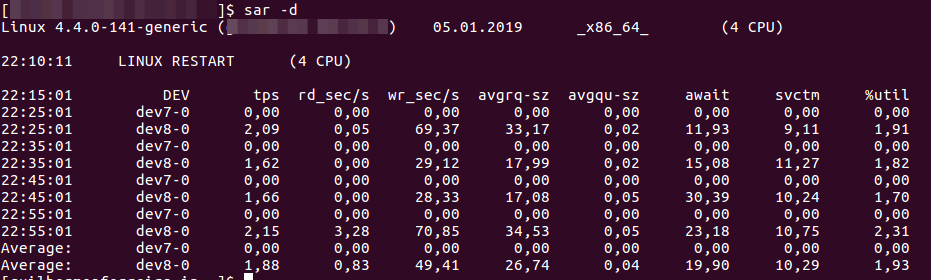
Like the previous one, the sar command reports stats about system CPU and Disk I/O usage, with some extra features and rules. Using the sar command, without any flag, will display all information related with CPU. This command has the flag “-d” about Disk I/O, the same as iostat but, in general, the stat display is a bit different.
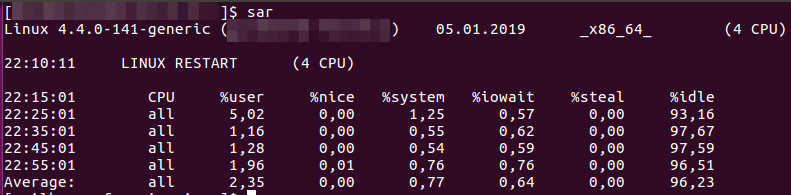
By default, sar collects data every 10 minutes and you may need to enable the data collection from sysstat service by setting the ENABLED flag to true, in the following file:
/etc/default/sysstat
The binary data read by the sar command comes from either /var/log/sysstat/sa<day-of-the-month> or /var/log/sa/sa<day-of-the-mouth>, depending of the Linux distribution. It will create a file for each day of the mouth and it will be overwritten in a monthly basis.
Things can get a little bit more interesting enabling colors to display the measurements from those commands:
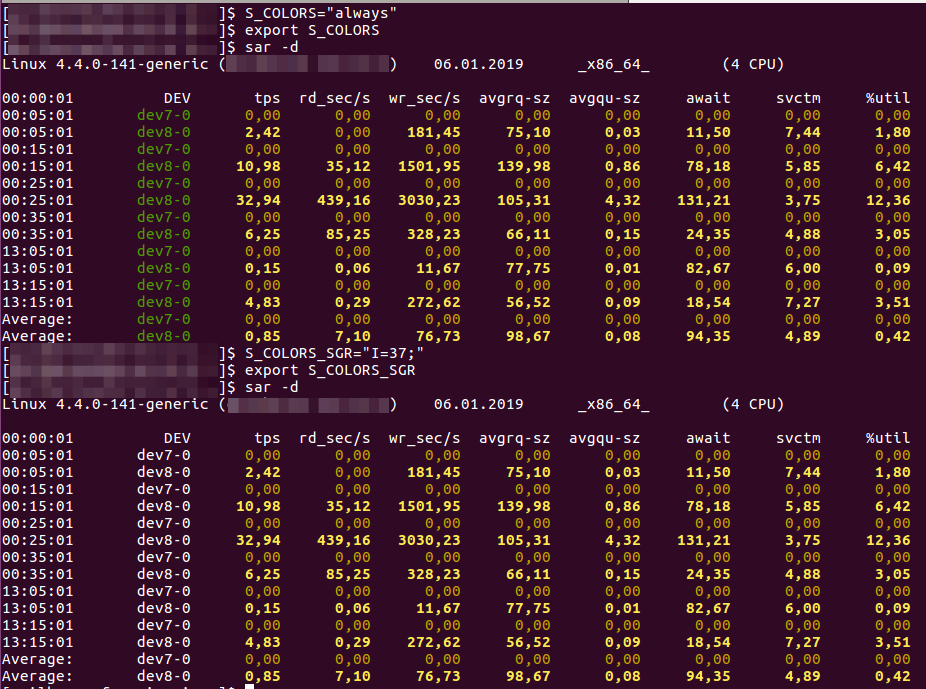
Setting the environment variable S_COLORS equals to true and then exporting it, enables the color feature, as shown in the first run in the screenshot above. If you would like to customize the color, for instance, related to the device names, you can do so by editing the I parameter for the environment variable S_COLORS_SGR.
If you want to know more about colors in the Linux terminal and for those options enabled in the sar and iostat commands, check out the following links:
So That Is It!
Hopefully, that short introduction of these important two commands will give you some light over measuring CPU and Disk I/O.