

Hello everyone!
– Have you ever wonder how to track the requests processed by your Elastic Load Balancer?
For a couple of days, I have been facing some weird 500 errors requests over my client project. Surprisingly enough the application logs were not giving a nice clue about which endpoints was it coming from, so I decided to know all that was happening, from ground zero, by the access logs for the Application Elastic Load Balancer, simply because that is the first point that any incoming requests will hit.
That feature is always available within your Load Balancer configuration and gives you a nice way of tracking, while logs it all in a S3 Bucket. You don’t need to create a S3 bucket upfront to make it work! During the configuration process, the Elastic Load Balancer panel gives you a chance to do so.
The only down part (if so) is that those logs are saved in a raw format, like:
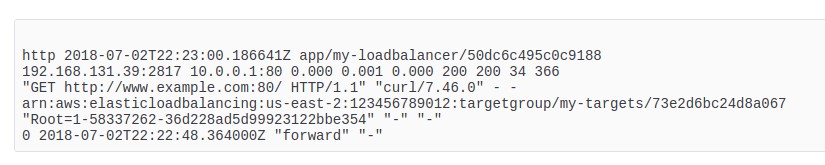
Even thinking that is great to have saved logs about your client requests, it raises an important question:
– How to make the access logs for Load Balancer pretty readable ?
I am quite sure that you would like to process all this information for any particular reason.
The good news is that is easily possible!
Amazon provides a nice way of triggering events within S3. You have a couple of triggers options to choose from but, what we are interested in for this article is the ability to process those logs files as soon as they arrive in the bucket.
If you already had some experience with Lambda, I am pretty sure that you know where we are going. If not, please take some time to understand what is the Amazon Lambda Service and think about improvements that it can provide for your project ( – Not only for logs ).
Remember that the main goal in here is to take all that uncleaned data and extract what you think that is useful, in a prettier form. After it gets formatted, we are going to use CloudWatchLogs API’s calls to save this content. In the future, you may even invest some time creating an interface with nice insights ( – If you did so, please share it with us! ).
Now that you already have a good idea about what we are going to archive, it’s time for the step-by-step tutorial:
1 – Search for the EC2 service.

2 – Scroll down to find the Load Balancer option.

3 – Select your Load Balancer and go to the Attributes tab. There, you should see a button related with Access logs. In my case, it’s a bit different because is showing the configuration that I already did.

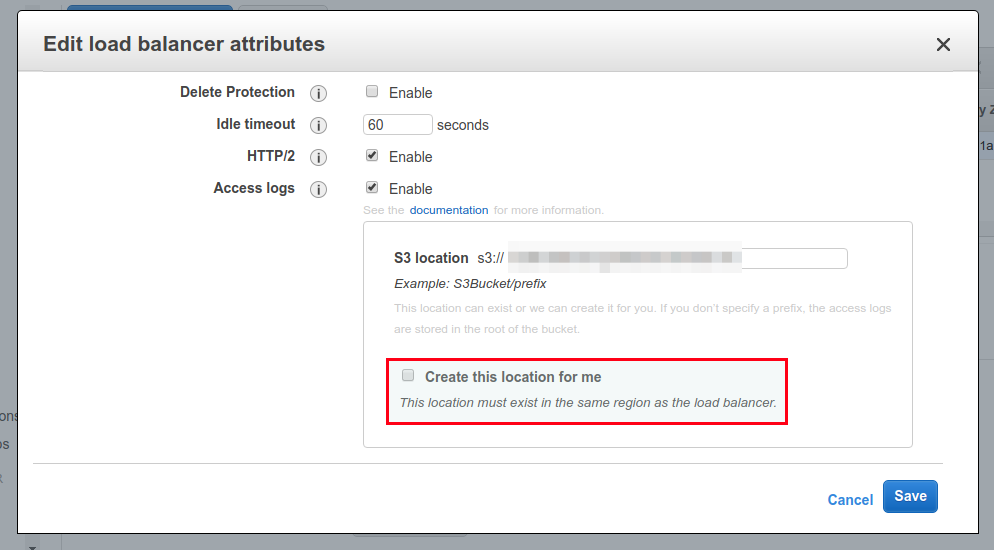
4 – In the pop-up settings, configure a bucket that you want to have all the requests saved. If you don’t have already a bucket created, just check the option Create this location for me.
Now it’s time to move towards the Lambda Service.
1 – While creating that Lambda function, you will need to provide a name (obviously) and set up the rules that this new Lambda function can execute. In our case, we will need to have permissions to Read S3 Objects and Create Logs within our CloudWatchLogs Service.

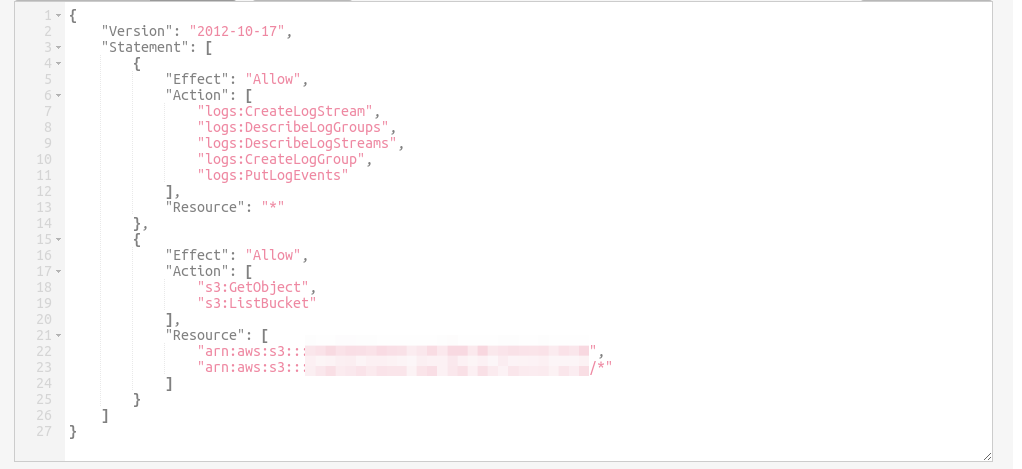
2 – The IAM role permission must be at least like below. If you prefer, you have available an example policy to enable your Lambda function to create custom logs with CloudWatchLogs API.
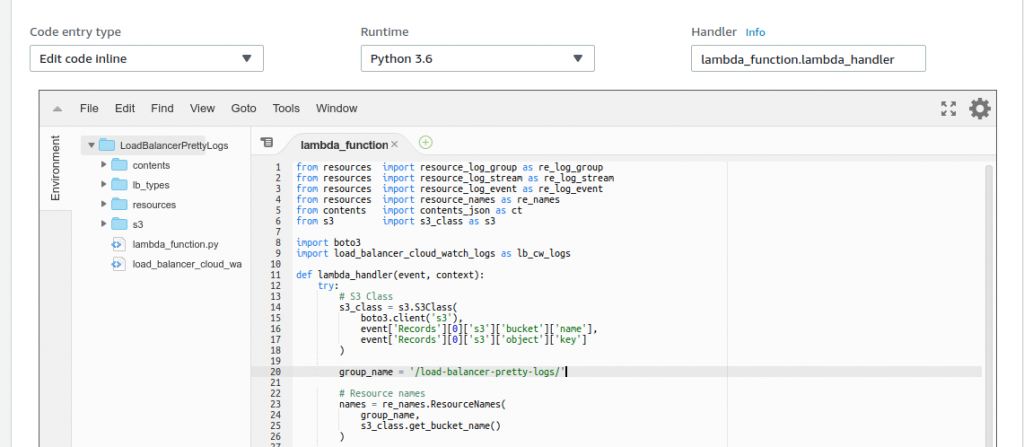
3 – Now that our new Lambda function is created, we need to import the Python script. I created a GitHub repository with the Load Balancer Pretty Logs code. If you think that something could be done better, feel free to make a pull request!
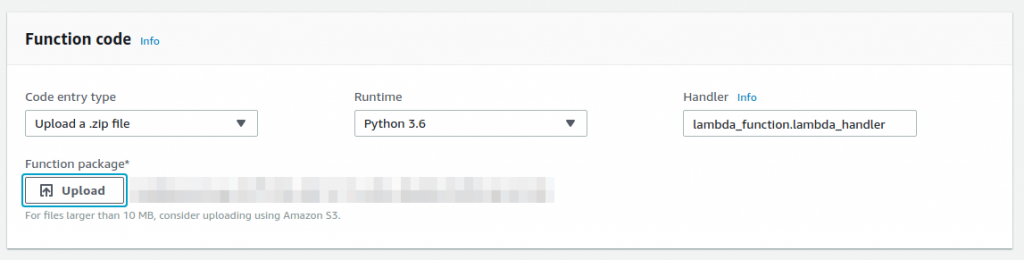
4 – After importing the function code, you may want to change the Log Groups name. By default, I set it as load-balancer-pretty-logs.
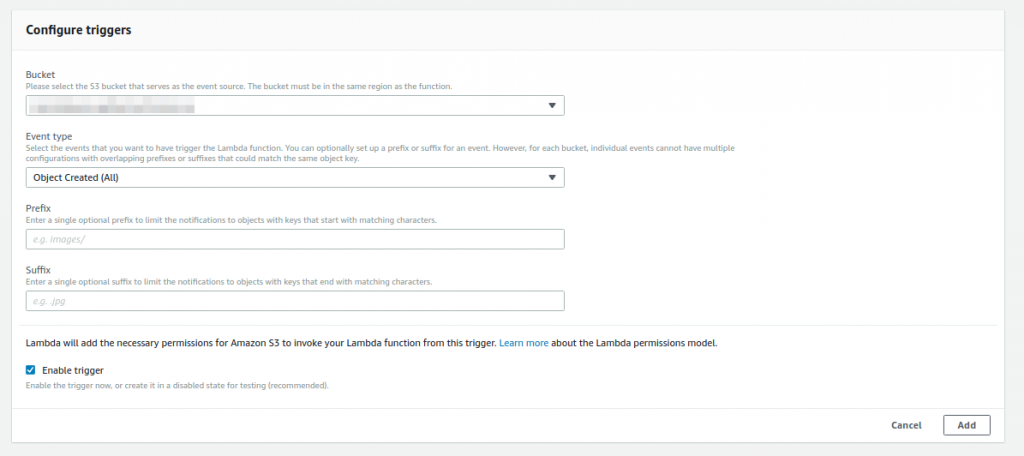
5 – You need now to configure the S3 trigger, from your recently created bucket, to call the Lambda function. To do it, move up to the Designer section of your interface. In there, drag and drop the S3 service on the first left side part, known as trigger box.

6 – Within the configuration options, select your bucket from the Bucket list and Object Created (All) from the Event type. The rest of the options are available for you to filter which type of file pattern that should be used. In our case, we want all the files, so leave it blank.
7 – If everything went well, you should see a valid confirmation message as Saved. Pay attention to the fact that you have a chance to enable and disable this trigger easily. That is cool because you don’t need to delete and reconfigure it every time that you want to provide some changes for the code. The last thing that you will need to do is simply save all what we just did!
If your project is not quite busy, just move around your pages to create hit traffic that will be logged in your S3 bucket.

8 – Go to the CloudWatch panel and inside of the Logs tab, you should see two log groups. The first one is automatically created by the execution of your Lambda function. The “last” log group is the result of what we expected.

9 – Following the logs created by our Lambda function, you should see something like below.
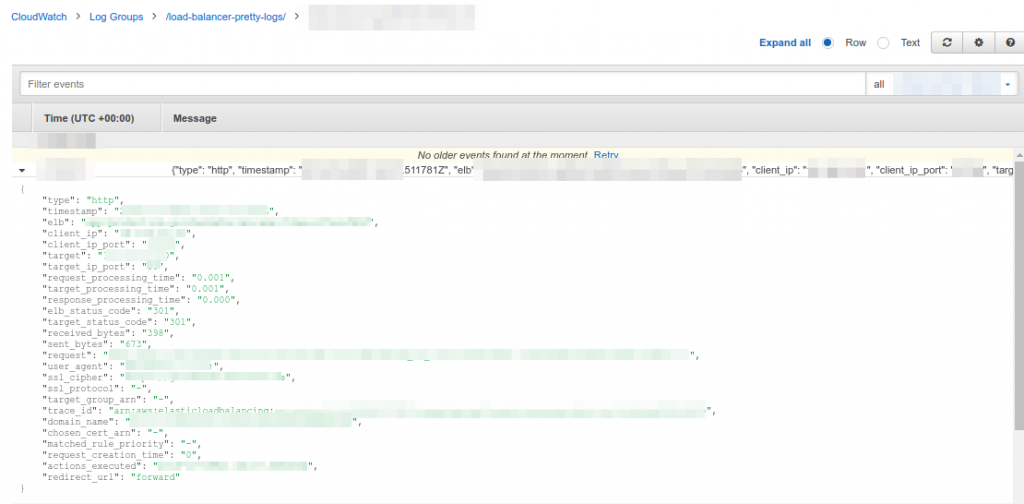
We are now logging all the requests but, I believe that you would like to have recorded only a group of status code, 300 or 500, and not build a simpler version of Google Analytics report…
That is it! Now you have a much better way for viewing and possibly analyze your customer requests hitting the Elastic Load Balancer.
* Remember that my example just take care of Application Load Balancer Type Logs, If you are using a Classic Load Balancer, you should see the Access Logs for Classic Load Balancer post (the format is a bit different).